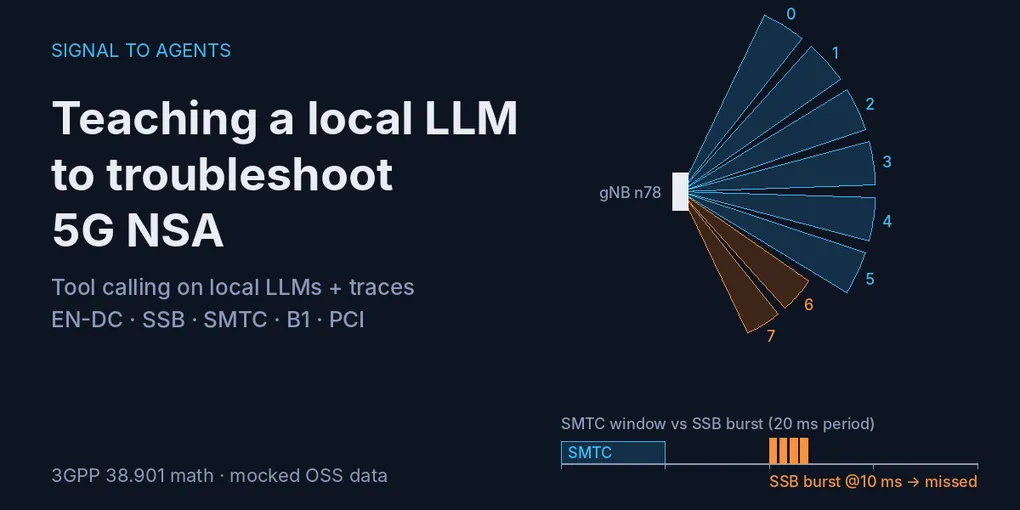
Every RF engineer working on 5G NSA has seen this ticket: “the anchor has n78 coverage, the phones support 5G, but users almost never get the 5G icon.” Drive tests show strong SS-RSRP, nothing alarms, and yet the EN-DC time ratio sits at 2 %.
Ask a language model about it and you get a reasonable checklist: B1 threshold, X2, NR neighbors, SMTC. What you don’t get is your SMTC offset, your gNB SSB timing or your B1 counters. The model has never seen your network, so it fills the gap with plausible text.
Tool calling closes that gap. You give the model functions it can call (read the EN-DC KPIs of this anchor, audit its NR measurement config against the gNB, show me SS-RSRP per SSB beam). The model decides which function to call and with which arguments; your code returns real data; the model reasons over it.
I work in RAN optimization, so I built a small 5G NSA troubleshooting agent that runs 100% locally on Ollama. I started with Gemma 4, an open-weight model with native function calling, and ended up comparing it with Qwen3 8B; the traces decided. I built the agent twice:
- Under the hood: a zero-dependency loop in Python’s standard library.
- With LangChain: the same agent with
create_agent, which is what I would use in practice.
All network data here is fictional and the propagation model is simplified. This is a learning lab, not a production tool.
30-second EN-DC refresher
In NSA option 3x the UE attaches to LTE. The LTE cell, called the anchor or MeNB, tells the UE where to look for NR: a measObjectNR with the SSB frequency (NR-ARFCN), the SSB subcarrier spacing, and an SMTC (SSB-based measurement timing configuration). The SMTC is the time window in which the UE listens for SSBs.
When the n78 SS-RSRP is above the B1 threshold, the UE sends a report, the anchor requests an SgNB addition over X2, and the UE adds NR as a secondary cell group (SCG). If NR coverage collapses afterwards, you get an SCG failure.
So every link in that chain can break EN-DC without a single alarm: wrong SSB frequency, an SMTC window that misses the SSB burst, a B1 threshold that is too strict or too loose, X2 down, PCI conflicts, weak SSB beams.
Setup: Ollama + a model that supports tools
Gemma 4 has function calling built in, even in its small “edge” variants. Pull the model and check that Ollama exposes the tools capability:
ollama pull gemma4:e2b
ollama show gemma4:e2b      # "Capabilities" must include: tools
This check saves time. Gemma 3, for example, answers does not support tools (status code: 400) the moment you pass a tool list, and some early Ollama releases had a broken tool parser for Gemma 4. Update Ollama first if tool calls come back as plain text.
The toolbox
| Tool | Type | What it does |
|---|---|---|
nr_link_budget |
Physics | 3GPP TR 38.901 UMa path loss → n78 SS-RSRP and margin vs B1 |
get_endc_kpis |
Mock OSS | B1 reports, SgNB addition, SCG failures, EN-DC time ratio |
audit_endc_config |
Mock OSS + rules | Anchor measObjectNR vs real gNB SSB: NR-ARFCN, SCS, SMTC vs SSB timing, B1, X2 |
check_nr_pci_conflicts |
Mock OSS + rules | NR PCI collision, mod-3 (PSS), mod-30 (UL DMRS/SRS) |
ssb_beam_report |
Mock DT / L3 MR | SS-RSRP, SS-SINR and sample share per SSB beam (L_max = 8 at n78) |
The physics tool computes instead of remembering. LLMs are bad at logarithms and worse at remembering the 38.901 breakpoint distance. A function gets it right every time:
def nr_link_budget(distance_m: float, bs_height_m: float = 25.0, freq_ghz: float = 3.5,
                   los: bool = False, tx_power_dbm: float = 53.0,
                   ssb_beam_gain_dbi: float = 18.0, bandwidth_mhz: int = 100,
                   indoor: bool = False, b1_threshold_dbm: float = -105.0) -> dict:
    """Estimate n78 SS-RSRP at a distance (3GPP TR 38.901 UMa) and whether it passes the B1 threshold.

    Args:
        distance_m: 2D distance from the gNB to the user in meters (10 to 5000).
        ...
    """
    pl = _uma_path_loss(distance_m, bs_height_m, 1.5, freq_ghz, los)
    epre = tx_power_dbm - 10 * math.log10(12 * n_rb)          # SSB energy per resource element
    ss_rsrp = epre + ssb_beam_gain_dbi - pl - (20.0 if indoor else 0.0)
    return {"path_loss_db": round(pl, 1), "ss_rsrp_dbm": round(ss_rsrp, 1),
            "passes_b1": ss_rsrp >= b1_threshold_dbm, ...}
The docstring is not decoration. It becomes the description the model reads, so units and valid ranges go there.
The audit tool encodes engineering judgment as code. This is the check that matters most here. SSB bursts repeat every ssb_periodicity starting at some offset; the UE only listens during [smtc_offset, smtc_offset + duration). If the burst falls outside that window, the UE never measures NR:
# SSB bursts occur at burst_offset + k * ssb_periodicity; SMTC window = [offset, offset + duration)
delta = (nr["ssb_burst_offset_ms"] - smtc["offset_ms"]) % nr["ssb_periodicity_ms"]
window_ok = delta < smtc["duration_ms"]
period_ok = smtc["periodicity_ms"] % nr["ssb_periodicity_ms"] == 0
if not (window_ok and period_ok):
    findings.append({"check": "smtc_alignment", "severity": "critical",
                     "impact": "SMTC window misses the SSB burst: UE cannot measure NR, B1 rarely triggers",
                     "fix": {"smtc_offset_ms": nr["ssb_burst_offset_ms"] % smtc["periodicity_ms"]}})
One honest caveat on ssb_beam_report: standard PM counters are per cell, not per SSB beam. Beam-level SS-RSRP comes from a drive-test scanner that decodes the SSB index, or from UE L3 measurement reports configured with per-SSB results (rsIndexResults), collected through MR/MDT or vendor traces. What is available depends on the vendor and the licenses, so the tool returns a source field and the agent should treat it as a different, sparser kind of evidence than KPIs.
The mock network has two LTE anchors and three n78 cells, each anchor with a problem baked in.
Part 1: the loop, under the hood
Frameworks hide two things: turning a Python function into a JSON schema, and the loop. Both fit on one screen (trimmed here; the repo has the full version).
The schema comes from type hints plus the Args: section of the docstring:
PY_TO_JSON = {float: "number", int: "integer", str: "string", bool: "boolean"}

def function_to_schema(fn) -> dict:
    doc = inspect.getdoc(fn) or ""
    description = doc.split("\n\n")[0].replace("\n", " ")
    arg_docs = dict(re.findall(r"^\s{0,8}(\w+): (.+)$", doc.split("Args:")[-1], re.M))
    props, required = {}, []
    for name, param in inspect.signature(fn).parameters.items():
        props[name] = {"type": PY_TO_JSON.get(hints[name], "string"),
                       "description": arg_docs.get(name, "")}
        if param.default is inspect.Parameter.empty:
            required.append(name)
    return {"type": "function", "function": {"name": fn.__name__, "description": description,
            "parameters": {"type": "object", "properties": props, "required": required}}}
The loop calls Ollama’s /api/chat, runs whatever tools the model requests and feeds the results back:
for _ in range(MAX_STEPS):
    msg = chat(messages, schemas)             # POST /api/chat with the tool list
    messages.append(msg)
    calls = msg.get("tool_calls") or []
    if not calls:                             # plain text -> final answer
        return msg["content"]
    for call in calls:
        name, args = call["function"]["name"], call["function"]["arguments"]
        try:
            result = registry[name](**args)
        except Exception as exc:              # wrong name or bad args: tell the model
            result = {"error": f"{type(exc).__name__}: {exc}"}
        messages.append({"role": "tool", "tool_name": name, "content": json.dumps(result)})
Three details matter in practice:
MAX_STEPSis the circuit breaker. Small models sometimes call the same tool again and again.- Errors go back as data. If the model invents a cell name, the tool answers
Unknown NR cell X. Known: [...]and the model can correct itself on the next step. - Several calls per turn. The model can request the KPIs and the config audit at once.
The system prompt sets the troubleshooting order (KPIs first, then configuration, then RF) and one hard rule: never invent KPI or parameter values.
Part 2: the same agent with LangChain
from langchain.agents import create_agent
from langchain.tools import tool
from langchain_ollama import ChatOllama

lc_tools = [tool(fn, parse_docstring=True) for fn in TOOLS]

agent = create_agent(
    model=ChatOllama(model=MODEL, base_url=OLLAMA_HOST, temperature=0,   # gemma4:e2b or qwen3:8b
                     reasoning=False),                                  # no hidden thinking on CPU
    tools=lc_tools,
    system_prompt=SYSTEM_PROMPT,
)
agent.invoke({"messages": [{"role": "user", "content": "Anchor BAQ_034_A has 7.8% SCG failures. Diagnose."}]})
parse_docstring=True does what my function_to_schema did, and create_agent runs the loop as a graph of model and tools nodes. With LANGSMITH_TRACING=true, every model call and tool call is traced to LangSmith, which is far more useful than print when an agent takes a wrong turn.
Building it by hand first is what makes the framework readable. When a trace shows a tools node returning an error, you know exactly what happened, because you wrote that except yourself.
Test drive 1: “5G coverage is good but nobody gets 5G”
“Anchor BAQ_021_A: EN-DC time ratio is only 2 % although n78 coverage looks good in drive tests. Diagnose and propose actions.”
These are the actual tool outputs the agent receives.
get_endc_kpis("BAQ_021_A")
{
  "endc_capable_ue_pct": 64.0,
  "b1_reports_per_1000_ue": 3,
  "sgnb_add_attempts": 41,
  "sgnb_add_success_pct": 97.6,
  "scg_failure_pct": 0.9,
  "endc_time_ratio_pct": 2.1
}
Additions succeed when they happen (97.6 %), but they almost never happen: 3 B1 reports per 1,000 UEs. The problem is upstream of admission. UEs are not reporting NR at all.
audit_endc_config("BAQ_021_A") (the single finding, slightly trimmed)
{
  "check": "smtc_alignment",
  "nr_cell": "BAQ_021_N78_A",
  "severity": "critical",
  "anchor_smtc": {"periodicity_ms": 20, "offset_ms": 0, "duration_ms": 5},
  "gnb_ssb": {"periodicity_ms": 20, "burst_offset_ms": 10},
  "impact": "SMTC window misses the SSB burst: UE cannot measure NR",
  "fix": {"smtc_offset_ms": 10}
}
The UE listens from 0 to 5 ms; the gNB transmits its SSB burst at 10 ms. Coverage is fine; timing is not. ssb_beam_report("BAQ_021_N78_A"), from a scanner drive test, confirms it: every beam is between −95 and −83 dBm with SS-SINR between 8.8 and 16.1 dB.
Expected recommendation: set the anchor SMTC offset to 10 ms, then verify that B1 reports and EN-DC time ratio recover over the next 24 hours.
Test drive 2: “We get 5G, then lose it”
“Anchor BAQ_034_A has 7.8 % SCG failures. Diagnose.”
The KPIs show the opposite picture: 820 B1 reports per 1,000 UEs, 5,400 addition attempts, 38 % EN-DC time, but 7.8 % SCG failures and only 145 Mbps on NR. Three tools, three contributing causes:
audit_endc_config: B1 threshold at −124 dBm, too permissive. NR gets added where it cannot be held.ssb_beam_report("BAQ_034_N78_A"), from L3 measurement reports with per-SSB results: SSB beams 6 and 7 are weak (SS-RSRP −112 and −115 dBm, SS-SINR below 0 dB) and carry 18 % of the samples.check_nr_pci_conflicts("BAQ_034_N78_A"): PCI 123 vs neighbor PCI 120, a mod-3 conflict (same PSS sequence). Suggested replacements: 2, 5, 8.
The physics tool explains why the B1 value matters. At 500 m NLOS, an outdoor UE gets −94.1 dBm; the same UE indoors (20 dB O2I) gets −114.1 dBm. That is still above −124, so the UE is added to NR, but it sits well below the −110 to −105 dBm range typically used as a starting point for B1, where the SCG has a reasonable chance to survive. Expected recommendation, in order: raise B1, fix the PCI, then review the coverage of beams 6–7. Whether a 2B model actually gets there is the next section.
What actually happened: observability closes the loop
Everything above is what the tools return. The real question is what a 2B-parameter model does with them. I ran three questions against gemma4:e2b on my lab server: the two cases above, plus an open-ended one in Spanish, the way a field engineer would ask it (“Users at site BAQ_021 barely see the 5G icon. What would you check first?”).
Run 1: the first prompt
| Case | Tools called | Root causes found | What went wrong |
|---|---|---|---|
| SMTC (BAQ_021_A) | 2 | 1 of 1 | Nothing. Correct diagnosis, correct fix (SMTC offset → 10 ms) |
| SCG failures (BAQ_034_A) | 2 | 1 of 3 | Stopped after the first finding: never checked PCI or SSB beams. Also called a −124 dBm B1 “too high” |
| Open question (BAQ_021) | 1 | 0 | Told the user to run audit_endc_config instead of calling it |
The terminal only shows the final text, and the final text sounds fine. The trace does not: it shows exactly one tool call, then a model message that hands the work back to the human. That is not a data problem; it is a loop problem.
Fix 1: make the process explicit
Small models do not infer a troubleshooting procedure; they need it written down. The system prompt became a checklist: KPIs, then configuration audit, then PCI and SSB beams for every NR neighbor; report every finding; never ask the user to run a tool. I also removed an ambiguity in the tool itself: the B1 finding now says "too low (too permissive)" explicitly, so the model cannot flip it.
Run 2: better, and two new failure modes
| Case | Tools called | Root causes found | What went wrong |
|---|---|---|---|
| SMTC (BAQ_021_A) | 5 | 2 of 2 | Followed the full checklist, found the SMTC and the NR PCI mod-3, and used the beam report to rule out coverage. Minor: one duplicated tool call |
| SCG failures (BAQ_034_A) | 3 | ? | Ended with no answer at all. The terminal showed three tool calls and then nothing |
| Open question (BAQ_021) | 1 | 0 | Called the tool with the site ID (BAQ_021), got an error, and instead of retrying wrote “(the tool would be executed here)” and simulated the whole diagnosis with placeholder values |
The third one is the scariest failure mode an agent has: the output looks like work, with headings, a checklist and an action table, but nothing was executed. Without a trace you would only notice by reading carefully. With a trace it is obvious: one tool call that returned an error, and then prose.
The second one taught me something about my own code. My console printer only showed tool calls and non-empty final answers, so a malformed tool call (invalid_tool_calls) or an empty final message disappeared silently. The agent did not crash; it just stopped talking.
Fix 2: errors the model can act on, and no silent endings
- Tools resolve what they can. A site ID that maps to exactly one cell (
BAQ_021→BAQ_021_A) is resolved inside the tool. When it cannot be resolved, the error says what to do: “Call the tool again with an exact anchor ID from: […]”. Returning errors as data only works if the model can act on the error. - Two more rules in the prompt: if a tool returns an error, fix the arguments and call it again; never describe or simulate a tool call, make it.
- The runner prints what used to be invisible: invalid tool calls, empty final messages, and a one-line summary per run (
model | tool calls | seconds).
Run 3: the model becomes the bottleneck
With the loop fixed, gemma4:e2b still could not finish. The new runner output made it explicit:
- SCG failures: one tool call, then
!! model returned an empty final message (done_reason=stop, eval_count=1). The model produced a single end-of-turn token and stopped. - Open question: it wrote
call: get_endc_kpis{anchor_cell_id: "BAQ_021_A"}as text, with the right ID this time, but in a format Ollama’s tool parser did not recognize. Zero tools executed.
So I ran the same three questions, with the same prompt and the same tools, on qwen3:8b:
| Case | Model | Tools called | Real causes found | Unsupported recommendations | Time |
|---|---|---|---|---|---|
| SCG failures | gemma4:e2b | 1 | 0 of 3 (empty answer) | — | 22 s |
| Open question | gemma4:e2b | 0 (tool call leaked as text) | 0 of 2 | — | 10 s |
| SMTC | qwen3:8b | 4 | 2 of 2 | 2 | 213 s (cold start) |
| SCG failures | qwen3:8b | 4 | 3 of 3 | 0 | 188 s |
| Open question | qwen3:8b | 4 | 2 of 2 | 4 | 270 s |
qwen3:8b followed the checklist every time and found every real cause, including all three in the SCG-failure case, with the right direction for B1 and the PCI the tool suggested. On CPU it takes three to four minutes per diagnosis; the small model is fast but cannot hold the loop.
It also showed a new failure mode: padding. In two of the three runs it added recommendations no tool supported, including tx_power_dbm = 53 dBm and ssb_beam_gain_dbi. Those are input assumptions of the link-budget tool, not network parameters. It also proposed raising a healthy B1 from −105 to −95 dBm “because it is too low”, with the reasoning backwards. In a NOC, that is the dangerous kind of wrong: a confident parameter change with no evidence behind it.
Fix 3: every action needs evidence
The prompt now requires each action to cite the tool finding that supports it, lists passed checks under “Checks OK” instead of turning them into actions, and states that tool arguments and assumptions are not network parameters.
Run 4: grounded answers, and what is left
Same model (qwen3:8b), prompt v4, the two cases that had padding:
| Case | Tools called | Real causes found | Unsupported parameter changes | Time |
|---|---|---|---|---|
| SMTC | 4 | 2 of 2 | 0 (was 2) | 224 s |
| Open question | 4 | 2 of 2 | 0 (was 4) | 228 s |
Every action now carries its evidence (Evidence: audit_endc_config, Evidence: check_nr_pci_conflicts), healthy beams show up under “Checks OK”, and the link-budget assumptions are gone.
What is left is subtler, and it is exactly what a prompt will not catch:
- Misquoted numbers. The summary says all beams are “above −85 dBm and 10 dB”. The tool returned −83 to −95 dBm and 8.8 to 16.1 dB.
- The wrong cell. “Change the PCI of the anchor”: the anchor is the LTE cell; PCI 120 belongs to the NR cell
BAQ_021_N78_A. - A false statement about its own process. “B1 threshold: not checked directly”, although
audit_endc_configchecked it and found nothing.
None of these change the diagnosis, but in an operations tool all three erode trust. They are also easy to test automatically: compare every number in the answer with the tool outputs in the trace, check that each recommended parameter belongs to the cell it names, run an LLM-as-judge on the rest. That is evaluation, and it is the next post.
What the traces say about latency
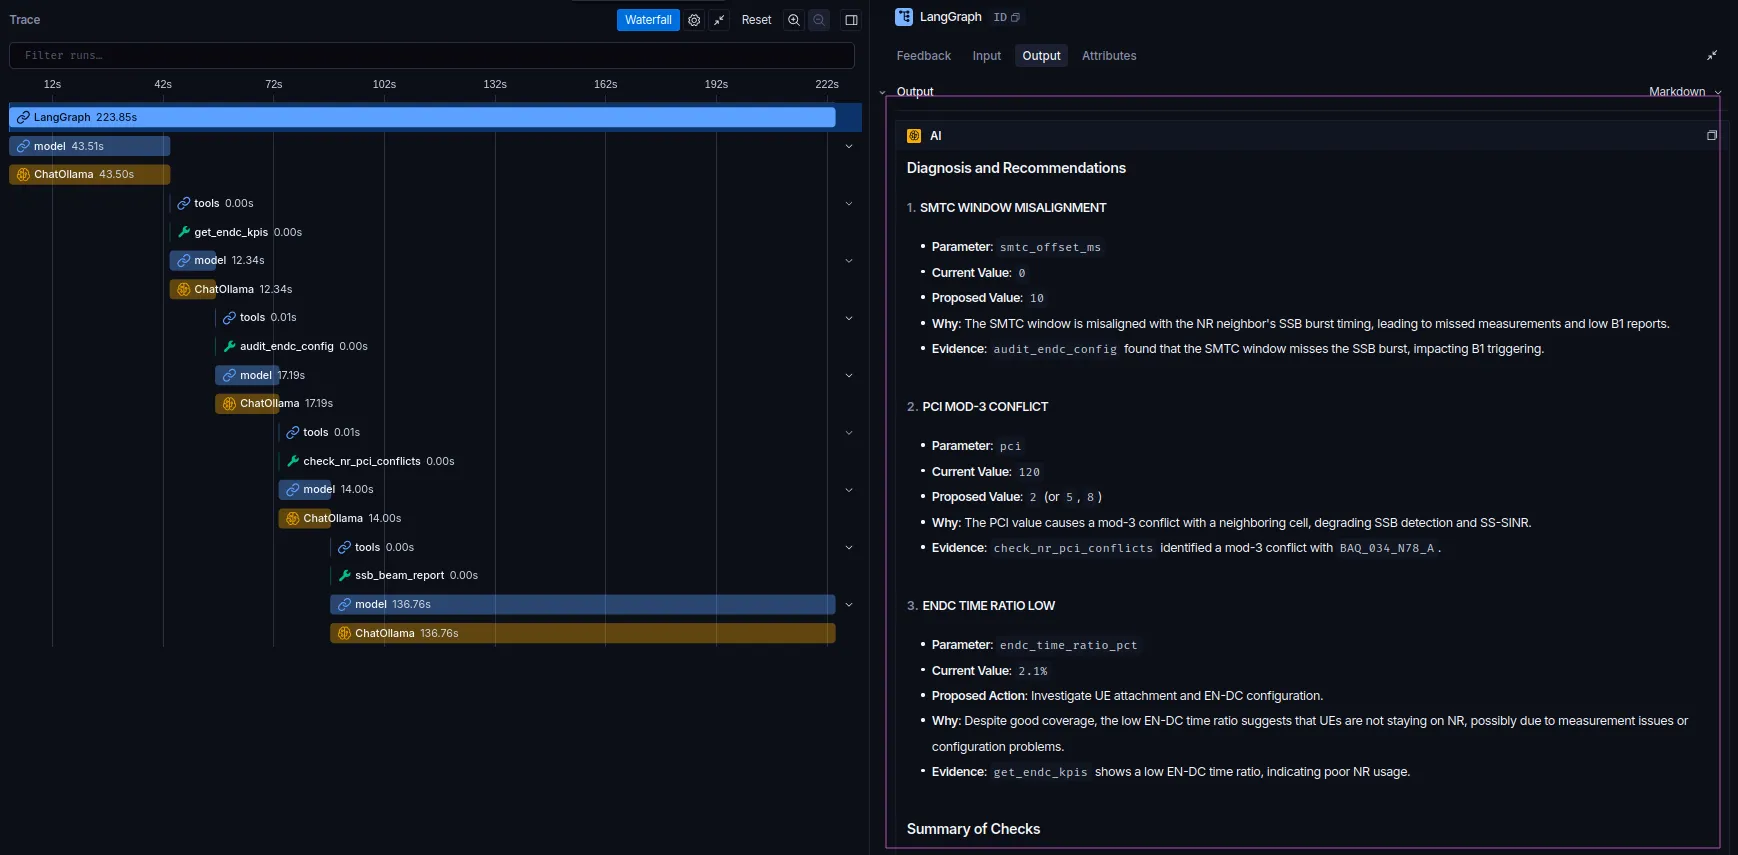
Run 4, SMTC case in LangSmith. Left: the waterfall. Right: the final answer, with the evidence for each action.
The waterfall answers a question the terminal never could: where do the 224 seconds go?
| Step | SMTC case (224 s) | Open question (228 s) |
|---|---|---|
| Each of the 4 tool calls | 0.00–0.01 s | 0.00–0.01 s |
| Model steps that choose the next tool | 43 + 12 + 17 + 14 s | 9 + 12 + 18 + 14 s |
| Writing the final answer | 137 s (61 %) | 175 s (77 %) |
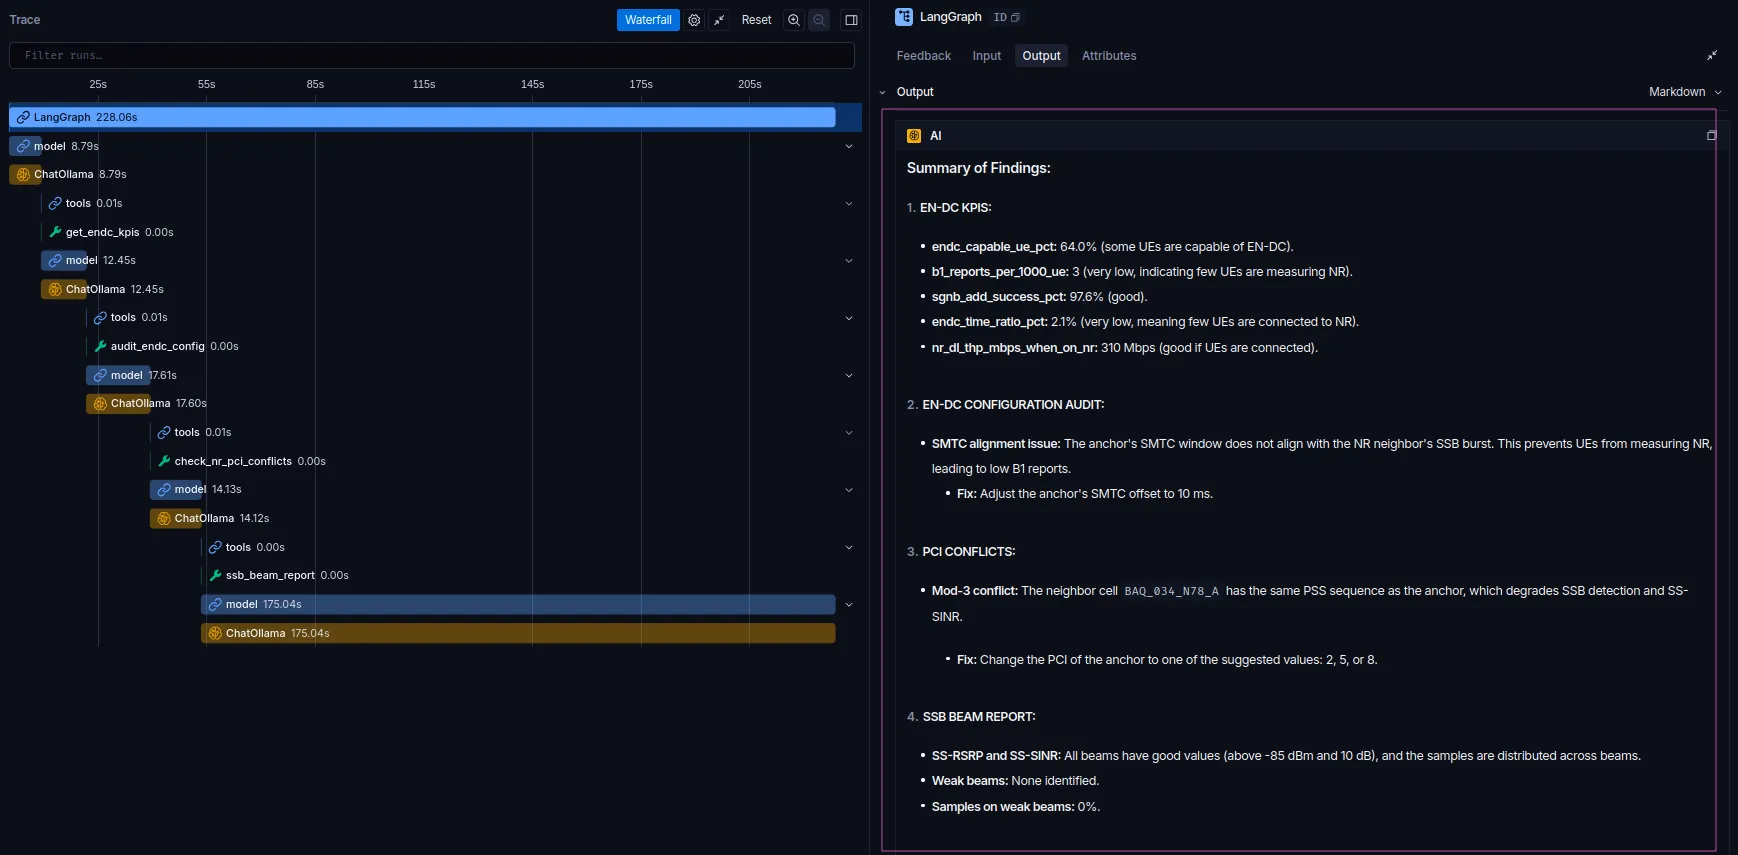
Run 4, open question. The tools are instant; the last model step dominates.
The tools are free. Most of the time is the model writing a long, formatted report on a CPU. So the next optimization is not in the tools or the loop: it is a shorter answer format (or a token cap), or a GPU. Without the trace, the natural guess would have been “the agent is slow because it calls five tools”, and it would have been wrong.
The pattern
None of these fixes came from staring at the final answer. Each one came from looking at what the agent actually did: which tools it called, with which arguments, what came back, and where the loop ended. That is the whole argument for observability in agents. A wrong answer from a single LLM call is a bad answer; a wrong trajectory in an agent is invisible unless you trace it.
It is also why every change was measured on the same three questions instead of “it looks better now”. Three questions are not an evaluation, but they are the seed of one, and that is the next post.
Lessons from the lab
- Check the tools capability before blaming your code.
ollama show <model>saves an hour of debugging a 400 error. - Let tools own the numbers. The model chooses the next step and explains; code computes and reads data.
- Docstrings are prompts. Units, ranges and KPI definitions in the docstring noticeably improve the arguments the model sends.
- Return errors the model can act on. An
{"error": ...}keeps the run alive, but a small model only recovers if the error says exactly how to retry. Better still, resolve the obvious cases inside the tool. - Trace the trajectory, not just the answer. The worst failures (delegating to the user, simulating tool calls, ending silently) look fine in the final text and are obvious in the trace.
- Small models need the procedure written down. A checklist in the system prompt took the SMTC case from 2 tool calls and 1 finding to 5 tool calls and 2 findings.
- Prompt fixes have a ceiling; model size is a parameter too. Past a point,
gemma4:e2bcould not hold a 4-tool loop on Ollama, andqwen3:8bcould. Measure before you swap. - Demand evidence for every action. A capable model will pad its answer with plausible changes. Each recommendation should cite the tool finding behind it.
- Measure latency per step before optimizing. The tools took milliseconds; 61–77 % of each run was the model writing its final report on CPU.
- What the prompt cannot fix, evaluation must catch. Misquoted numbers and wrong cell names survive a good prompt. Check answers against tool outputs automatically.
- Encode the expert check, not just the data. The SMTC alignment rule is three lines of code that most generic LLM answers would never apply to your actual numbers.
- Human in the loop for writes. These tools only read and recommend. Changing SMTC, B1 or PCI on a live network needs approval, audit logs and rollback, and that is a design problem, not a prompt problem.
What’s next
Replacing the mocks with real counters and configuration exports is the obvious step, together with evaluating the agent: a dataset of anchors with known root causes, and measuring how often it finds them. That is exactly what I am studying now for the LangChain Certified Agent Engineer exam, so expect a follow-up on agent evaluation with LangSmith.
The full code (tools, both agents and offline tests) is on GitHub: codeviloria/5g-nsa-agent. The runs/ folder has the log of every iteration described here.
I’m a telecom engineer working on RAN optimization and moving into AI engineering. I write about agents, local LLMs and what happens when you point them at real engineering problems.